The AI-first unified platform for front-office teams
Consolidate listening and insights, social media management, campaign lifecycle management and customer service in one unified platform.


Instagram Analytics Guide: A Simple Guide for Quick Insights
Wouldn’t it be great if you could predict which of your Instagram posts will capture the attention of your target audience? With the immense popularity of Instagram — not just as a way for brands to engage with their audience — but as a popular ecommerce platform as well, it is critical for brands to get their Instagram strategy right.
However, to find what’s working, and what’s not — you need to get familiar with Instagram analytics. In today's digital landscape, where Instagram has become a powerful marketing tool, utilizing its analytics can offer valuable insights into audience preferences, content performance and the effectiveness of your social media marketing strategies. These insights are crucial for predicting what will resonate with your target audience.
In this article, we will cover everything you need to know about Instagram analytics. Discover the essential metrics to monitor and techniques for effective dashboard analysis.
Why is Instagram analytics crucial for businesses?
Aside from understanding the post-level performance of your content, Instagram analytics offers a range of insights regarding audience preferences, campaign strategy and overall brand impact. By understanding this, you can tailor your content to better connect with your audience and achieve your business goals
Instagram data analytics can help you:
1. Monitor account performance
Instagram analytics tracks your account’s growth by offering insights into customer engagement metrics, follower growth, audience behavior and content performance.
For example, if your followers are most active around 8 p.m., you can optimize your posting schedule to coincide with this peak period. This ensures your posts are seen by more people, leading to better customer engagement and increased reach.
Related Read: Social Media Posting Schedule: How to Get Started
2. Identify Instagram trends
Instagram data analytics helps you identify latest Instagram trends by providing real-time updates on audience preferences regarding content formats, themes and trends that are receiving the most engagement or hashtags that are seeing a spike in usage.
For example, monitoring metrics such as saves, shares and comments can identify formats and themes that generate more interaction and allow you to quickly jump into a trending topic and join the conversation.
3. Improve marketing ROI
Instagram analytics can also help you track and measure your marketing ROI. It provides valuable insights that can be leveraged to optimize resource allocation and measure the effectiveness of your social media campaigns. Businesses can predict the potential success of their campaigns by analyzing historical performance and adapting their content strategy accordingly.
For instance, understanding audience demographics and behaviors helps deliver timely and targeted content, maximizing conversion rates. Tracking website clicks and follower growth metrics gets you actionable data, allowing you to adjust your campaigns for optimal ROI.
4. Support strategic decision-making
Instagram analytics takes the guesswork out of your marketing strategy. These reports provide comprehensive Instagram insights on performance and offer critical insights that can shape content and marketing strategies. Performance data analysis helps identify best practices and trends that can expedite content planning and execution.
Instagram data analyzers can audit any profile, including competitors or top performers in your niche. These insights allow you to compare your performance with your competitors and identify key focus areas. By comparing their accounts to yours, you can assess and address the strengths and weaknesses of your content strategy.
Top Instagram metrics to track
There are a variety of metrics to track but if you are thinking about leveling up your content performance on Instagram. Track the following Instagram metrics:
Metric #1 - Follower growth rate
Monitoring the follower growth rate is a crucial aspect of Instagram marketing. It lets you see how your account's follower base expands over time. This means focusing on the rate of growth rather than just the increase in followers.
Formula:
Example:
Suppose you want to calculate the follower growth rate for the last month. Say you had 2000 followers at the beginning of the month. By the end of the month, you have 2200 followers.
As per the formula, 2200 - 2000 = 200 new followers.
Your initial follower count was 2000.
Then your follower growth rate is (200/2000) × 100 = 10%
Metric #2 - Impressions
Although often mistaken for reach, impressions represent the total number of times Instagram users viewed a post. This metric includes multiple views by the same user; for example, if someone scrolls through your content five times, all these views contribute to the impression count.
Formula:
Example:
If your Instagram post appears 2000 times in users' feeds, the impressions for that Instagram post is 2000.
Say a post might have 1000 reach and 2000 impressions. This indicates that many of those 1000 viewers likely viewed your content multiple times.
Metric #3 - Total engagement
The Instagram algorithm favors accounts with high engagement levels, making engagement one of the crucial metrics to monitor. The engagement metric measures the number of unique accounts interacting with your post through actions like liking, sharing, commenting, or saving. Tracking engagement is valuable because it indicates how actively your audience engages with your content.
Formula:
Example:
Post: 20 shares, 500 likes, 1000 comments, 60 saves
Total engagement: 20 + 500 + 1000 + 60= 1580
Also Read: 3 Effective Ways to Improve Customer Engagement on Social Media
Metric #4 – Reach
Reach indicates how far your content has traveled. It includes views from the feed, discover tab, location tags and hashtag searches. Reach analysis determines the buzz and brand awareness your content is creating on Instagram. By tracking it, you can evaluate how well your content strategy is performing. Regularly analyzing this data helps you assess your content’s performance and improvise if required.
Formula:
Example:
If 1000 unique Instagram users see your post, the reach of your Instagram post is 1000.
Metric #5 - Engagement rate
Engagement rate is a metric that reflects the percentage of people who engaged with your post. Analyzing engagement rates using Instagram data analytics will help you understand your audience’s interests and how connected they feel to your brand. This allows you to drive meaningful content and stand apart from your competitors. While Instagram Insights may not directly display the engagement rate, you can calculate it yourself.
Formula:
Engagement rate by Followers = (likes+comments)/posts/Followers x 100
Engagement rate by Reach = (likes+comments)/posts/Reach x 100
Example:
Suppose you have 10000 total followers.
And your total reach is 9000.
If 10 of your posts collectively gather 6000 likes and 600 comments.
Your engagement by Followers = (6000+600)/10/10000 x 100 = 6.6%
And your engagement by Reach = (6000+600)/10/9000 x 100 = 7.3%
💡 Pro Tip: To effectively engage your audience, it's crucial to understand what they’re talking about, the questions they’re asking, their expectations, and pain points. This is where social listening comes into play.
Improve your Instagram reach, impressions and engagement with Sprinklr’s Social Listening platform. It assists in comprehending unstructured data from online platforms and provides in-depth insights for each channel.

Deep Dive: The Ultimate Guide to Mastering Instagram Social Listening
Metric #6 – Shares
This metric shows how often your content was shared on Instagram. Widely shared content proves your audience liked it and found it worth sharing. Going viral through shares signifies that your content resonates strongly with your audience, demonstrating its appeal and value. It indicates a significant level of engagement and potential for extended reach across various platforms.
For instance, if a dance challenge has gone viral, you can recreate it to align with your content plan. This approach increases the chances of your post going viral, leveraging the success of the existing trend.
Metric #7- Story views
Instagram Stories are among the platform's most popular features. So, tracking their insights is crucial. These metrics provide valuable data on your content's reach, which marketing professionals and brands aiming for optimal results in Instagram marketing can leverage. Instagram Story insights indicate whether your brand has a finger on the pulse of your audience – and if the themes and trends in your strategy resonated with your audience.
💡 Pro Tip: Conduct audience analysis to understand audience preferences and brand perception. Segment your target audience based on demographics, behaviors and preferences.
Leverage Sprinklr Insights to discover what customers really want. The customer intelligence suite captures real-time customer feedback with industry-leading channel coverage.

Metric #8 - Play rate
The play rate metric captures the actual reach of your Reels. Initial plays provide insights into how well your content grabbed attention, while replays indicate how many times a Reel has been rewatched and proves that your content strategy is on the right track. Higher replays suggest you have accurately predicted what would work with your audience. Conversely, low replays and high initial plays signal a need to enhance content to encourage repeat views.
Analyzing Instagram analytics reports to track this data will help you understand how your audience engages with the video content you post and what adjustments you need to make to your content strategy.
Formula:
Example:
Assume your video has the following:
Total number of plays: 2000
Total impressions: 10000
So, your play rate is (2000/10000) × 100 = 20%
Metric #9 - Accounts reached
Tracking this metric provides demographic insights into post engagement. You'll discover your audience's top locations, content preferences and profile activities like button taps and visits. It also shows the reach among both followers and non-followers.
Formula:
Example:
Assume that your post reaches 2000 accounts.
And you have 20000 in all.
So, your account’s reach rate = (2000/20000) × 100 = 10%
Metric #10 - Hashtag engagement
Hashtag performance is a crucial metric to monitor in your Instagram analytics report. Analyzing hashtag engagement reveals how your hashtags spread and the audiences they reach, showing the effectiveness of your hashtag strategy. By creating successful hashtag campaigns, you can accelerate your overall Instagram growth.
Formula:
Example:
Suppose your post garners 50 comments, 100 likes, 20 saves and 70 shares.
Then, your total hashtag engagement = ∑ (50+100+20+70) = 240.
Recommended Read: How to Find the Hashtags That Actually Work
How to analyze the Instagram Analytics dashboard
The professional Instagram data analytics dashboard allows you to monitor performance, discover and access professional tools and explore the educational information curated by Instagram. This feature is available only to professional or creator accounts.
To find and analyze the professional dashboard, follow these steps:
Step 1: Open the app
Open your Instagram profile and click 'View' on the top right-hand corner to access the professional dashboard. You will find a few sections, such as:
1. Track your performance
2. Grow your business
3. Stay informed.
Step 2: Go to Insights
This section provides key insights on users reached in the last 30 days, essential for understanding your audience and refining your content strategy. Tap 'See all insights' to explore metrics like reach, engagement and views and their performance.
Step 3: Check Overview
This option allows you to access and discover new business tools and creators, such as branded content, subscriptions, orders, quick replies, ads, badges and more. This section will grow as you use more tools over time. You can click “See all tools” to check all the available tools.
Additionally, you can access your audience overview, content summary, top-performing posts, and more. Insights can be viewed using a custom timeframe or preset options.
Advanced tips for using Instagram analytics
In this section, explore advanced tips for leveraging Instagram analytics to refine your social media strategy and boost engagement effectively:
Monitor engagement trends over time
Track engagement metrics such as likes, saves, shares and comments over a longer period to identify themes that connect with your audience over time. Use this data to derive the optimal posting time or the type of content your audience likes. For instance, noticing a spike in shares for educational posts can guide you to create more informative content that your audience finds valuable and shareable.
Analyze follower growth patterns
Monitor follower growth metrics to understand your audience. Monitor fluctuations in your follower count, linking these changes to your social campaigns and content to decipher growth patterns effectively. For example, observing an increase in followers after running a giveaway campaign can indicate that such initiatives resonate well with your audience and contribute to audience expansion.
Dig deeper into audience demographics
It is crucial to track your followers' peak activity time, location, gender, age, etc., to customize your content to better resonate with their preferences and behaviors. For instance, understanding that your audience predominantly consists of young adults interested in fitness can help you create content focused on health tips and workout routines that resonate with them.
Related read: Social media demographics to know for 2025
Compare types of content
Evaluate various content formats such as reels, carousels, videos and photos to identify what works best for your engagement. Analyzing data may reveal that carousel posts consistently receive more likes and comments than single-photo posts.
Monitor competitor performance
Use Instagram Analyzer and other analytics tools to monitor your competitor's performance. For example, discovering that a competitor's use of interactive Stories results in higher engagement could inspire you to enhance your own Story content with dynamic elements.
Best Instagram analytics tools
Choosing the right Instagram analytics tool can make all the difference in driving impactful strategies. To help you make an informed decision, we’ve compiled a list of the top 5 tools — complete with features and capabilities worth comparing — to find the perfect fit for your goals.
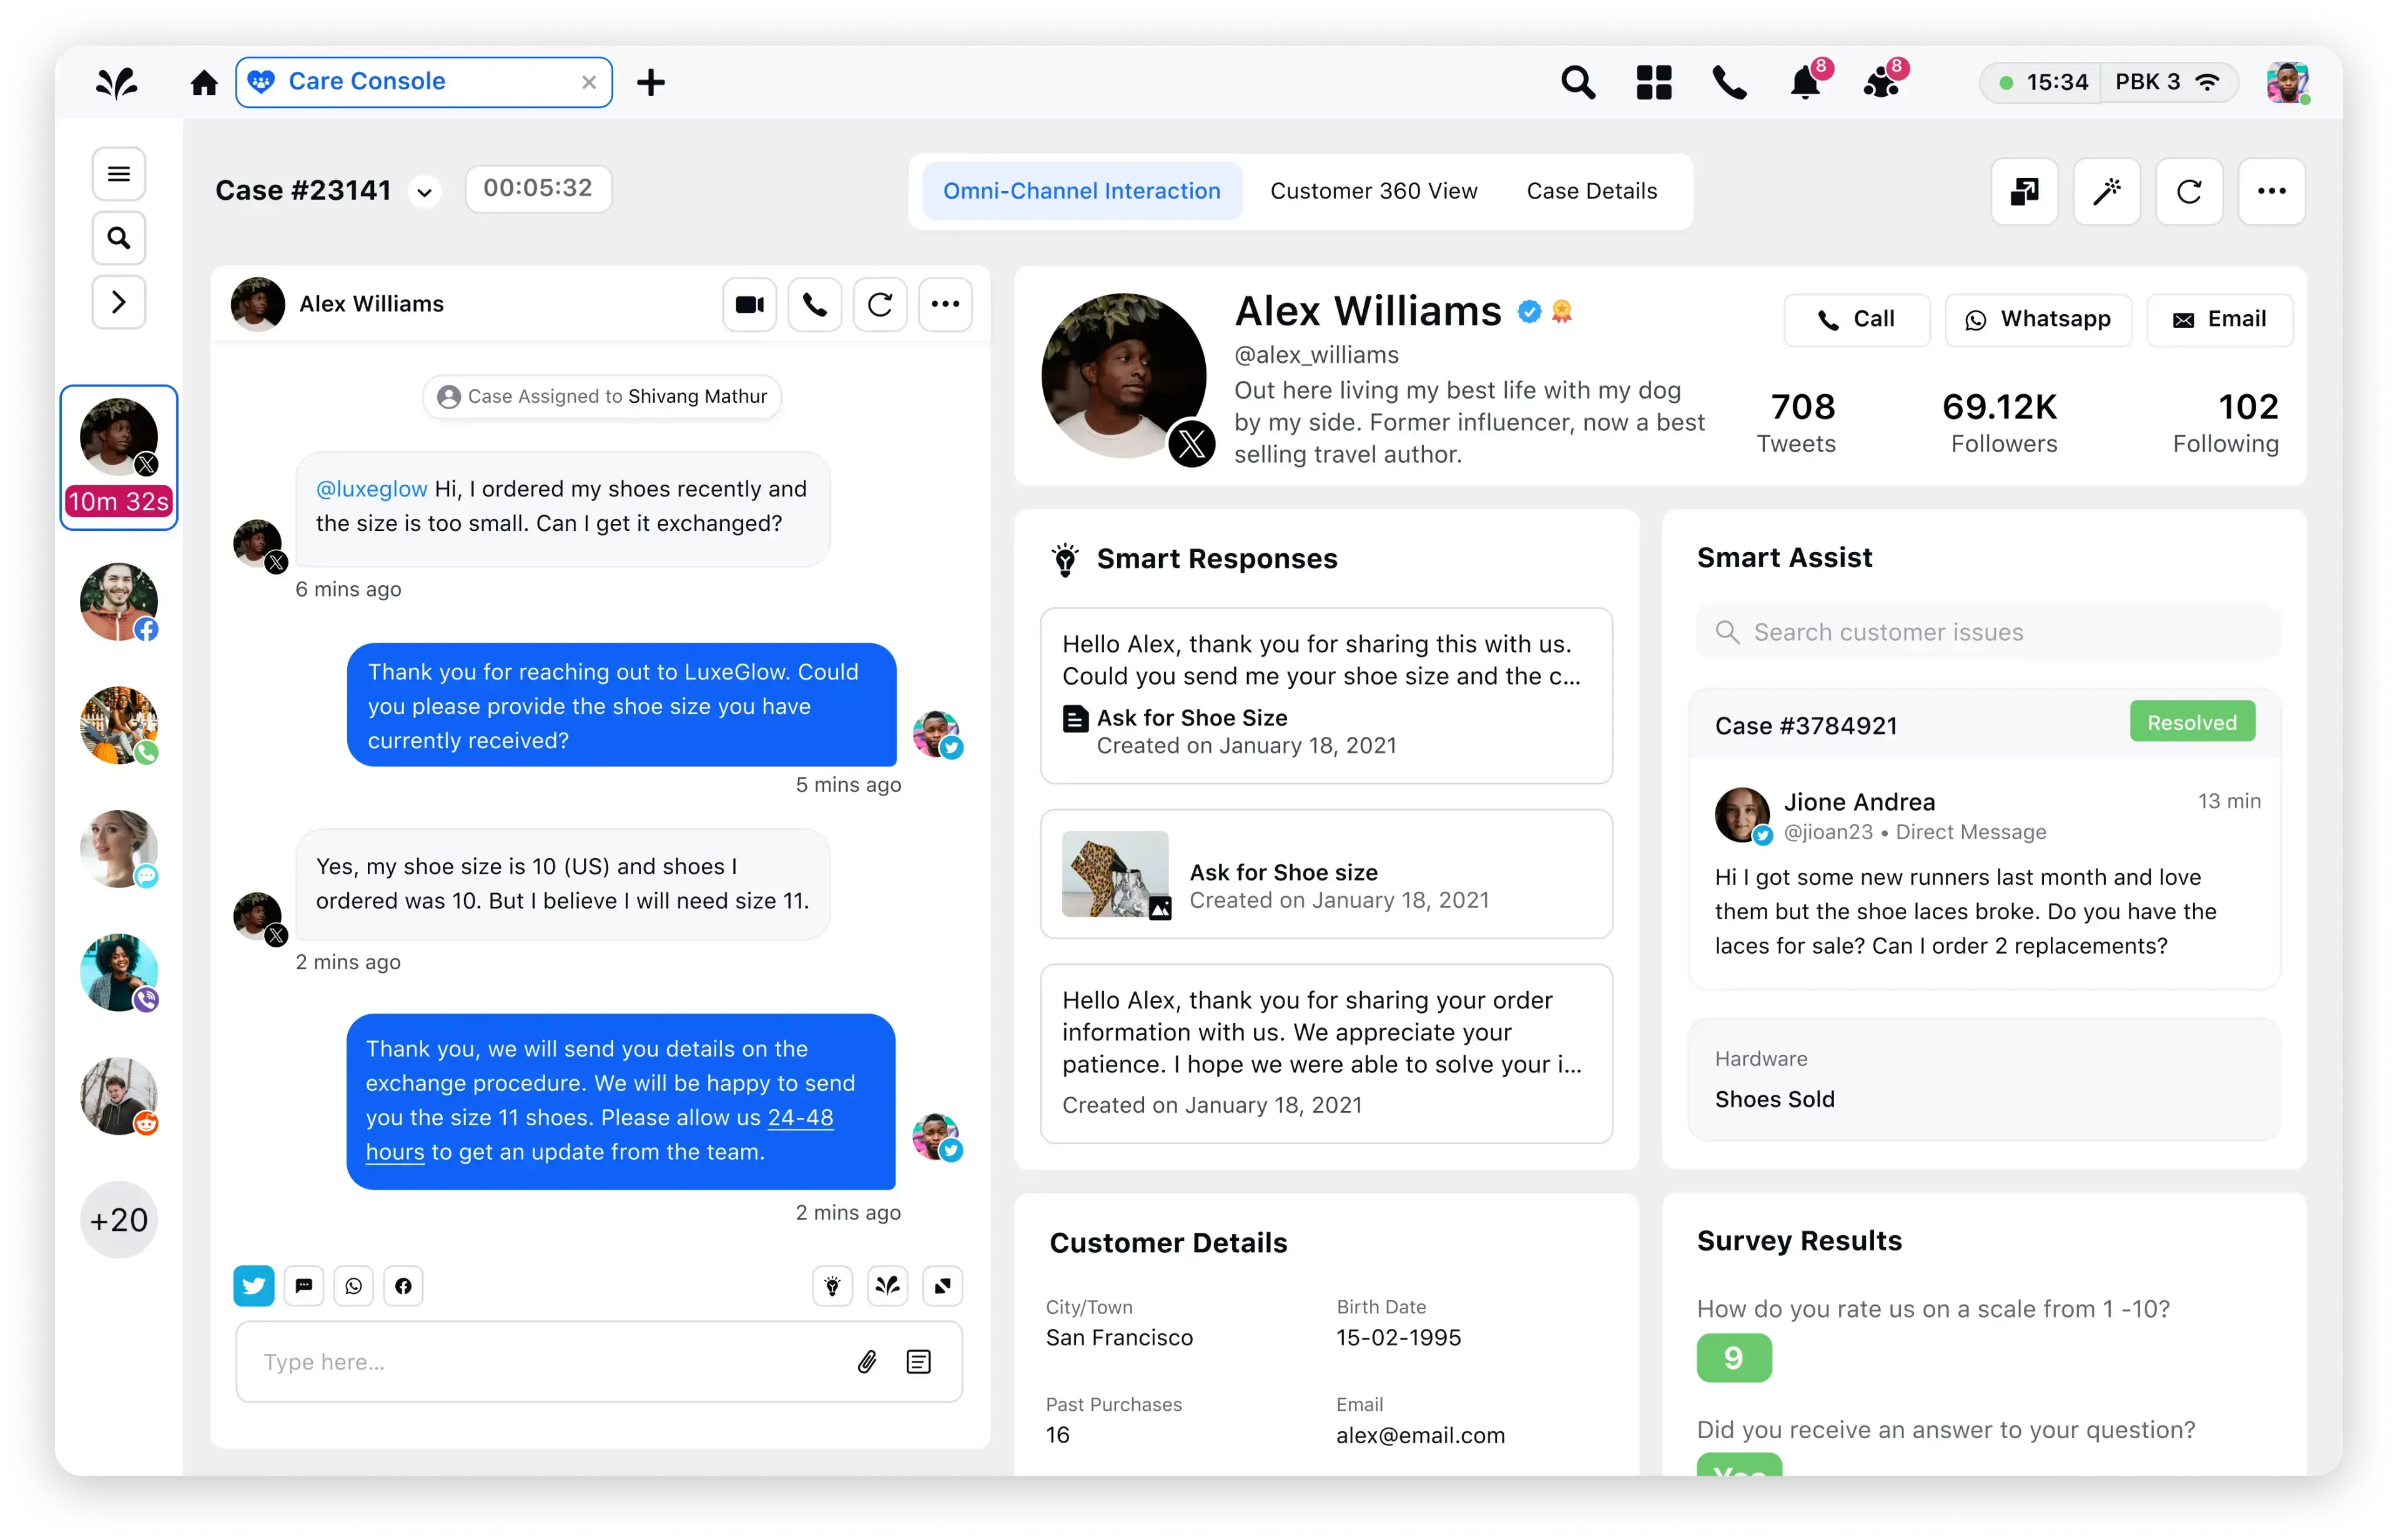
Sprinklr Social
Sprinklr’s Instagram insights allow you to monitor overall trends encompassing all your followers and understand how your content engages your audience. This tool also shows insights for specific stories, reels, videos, live videos and posts, helping you track how each one performed.
In addition to these insights, Sprinklr’s social media scheduling and publishing tool can also:
- Auto-schedule your posts and stories such that they’re published at the best AI-recommended times for optimal reach and engagement.
- Help you create, schedule and manage all your social posts from across 10+ social channels (including Instagram, of course) and through a single dashboard.
- Plan, execute and analyze Instagram campaigns across multiple social media platforms.
- Maintain brand integrity through customizable approval workflows, pre-defined governance rules and streamlined moderation processes.
Buffer
Buffer’s Instagram tracking allows you to evaluate your social media performance in the same tool that you use to create and schedule your social media content. For instance, Buffer's analytics suite provides insights into audience reach and completion percentage for your Instagram stories.
Later
Later's Instagram data analytics tool offers an intuitive solution for basic performance tracking. It allows you to assess the performance of your Instagram content and advises you on optimizing your posting schedule. Using Later's Instagram analyzer, you can monitor audience engagement data and identify trends.
HootSuite
HootSuite allows you to customize your dashboards. It provides research analytics across multiple marketing channels, including X (previously Twitter), Facebook and Instagram. The toolkit analyzes team campaigns, delegates tasks and identifies high-ROI content.
Mentionlytics
Instagram data analytics by Mentionlytics allows you to gather and analyze all your Instagram mentions. It provides a pervasive web tracking service. The toolkit can search various online platforms, including review pages, news websites, blogs and discussion forums, for brand mentions.
Make the most out of Instagram analytics
Analyzing Instagram metrics is essential for crafting a robust Instagram marketing strategy. But making sense of them requires some help. With Sprinklr Social, you will get comprehensive Instagram data analytics with actionable insights on how to improve your performance. The platform comes with in-depth listening, unmatched channel coverage and enterprise-grade configurability.
The best part?
You can book a personalized demo before you make a decision. Explore what’s possible with Sprinklr Social. Contact our experts to ramp up your social media game today!
Frequently Asked Questions
Depending on how often you share the content and the traffic you get, you can check your analytics daily or twice/thrice a week.
Yes, Instagram Analytics allows you to closely monitor what works for you and what doesn't regarding all types of content you post. You can adjust your content strategy accordingly, share what is liked by most consumers and attract new followers by retaining the old ones.
The best way to improve metrics is to create high-quality content that resonates with your followers, consistently post the content on social media, and actively engage with your Instagram followers.
Only the creator or influencer can access Instagram analytics and insights. A person with a personal or non-creator account cannot track these analytics.
Personal accounts do not have access to analytics, whereas business accounts do. They also have limited privacy settings, making it difficult for them to control who can engage with and see their content.
Many tools, including Instagram Analyzer and Sprinklr's competitive insights and benchmarking toolkit, can help you compare your performance against your competitors.