The next generation of CCaaS is here
Digital-first customer service, enterprise-scale voice support. Redefine customer service with an AI-powered platform that unifies voice, digital and social channels. Power channel-less interactions and seamless resolution no matter the channel of contact.
Top 9 Customer Experience KPIs to Monitor in 2025
These days, products and services are so similar that the real deal-sealer isn't the shiny features your marketing collateral boasts about — it's customer experience.
Bold claim? Maybe. But think about the last time you bought software or even that sleek projector for your fancy new meeting room. You probably checked the reviews, right? And how often has a bad customer experience in those reviews made you hit the pause button on buying?
That's why tracking customer experience KPIs has become a top priority for businesses of every size. While companies measure many different customer experience KPIs, a few stand out as the real MVPs — those that truly show whether your business is delivering a positive experience at every stage of the customer journey.
In this blog, we're diving into the ten best customer experience KPIs leading customer-centric businesses swear by.
What are customer experience KPIs?
Customer experience KPIs are measurable values that help you assess how well you meet customer expectations. These metrics offer crucial insights into the customer experience journey by highlighting key factors like satisfaction, loyalty and overall brand perception.
Tracking customer experience KPIs enables you to spot patterns and trends in customer behavior, which leads to more informed decision-making. For instance, if your net promoter score (NPS) starts to drop, that's an early warning sign that customer dissatisfaction is creeping in — giving you the chance to act quickly and address the root causes. Likewise, keeping an eye on customer retention rates can show how effective your customer engagement strategies really are.
Brands use these insights to fine-tune their offerings, improve customer interactions and ultimately drive growth.
Customer experience KPI vs. metric
While customer experience KPIs and customer experience metrics are often used interchangeably, there's a subtle distinction between them.
Customer experience metrics are any measurable data points that provide insights into how customers perceive and interact with your business. These metrics can be quantitative (e.g., customer satisfaction scores, net promoter scores) or qualitative (e.g., customer feedback, social mentions).
Customer experience KPIs are a subset of these metrics that are considered crucial for measuring the overall success of your customer experience strategy. They are typically tied to specific business goals and are used to track progress toward those goals.
Aspect | Customer experience KPI | Customer experience metric |
Purpose | Targets business objectives, such as customer retention or revenue growth | Provides detailed data points, such as the number of customer complaints or average response time |
Scope | Uses broad data relevant over the long term and aligned with overall business goals | Leverages focused data relevant over the short term and used to monitor specific processes |
Actionability | Guides strategic decisions like prioritizing initiatives, such as product development, or efficient allocation of resources. | Enables operational improvements, such as optimizing an internal process to reduce time and costs. |
Why is it important to track customer experience KPIs?
Tracking customer experience KPIs allows you to take timely corrective actions that could otherwise lead to lost business and customer churn. Here's why keeping an eye on these is crucial:
Enhances customer satisfaction
Regularly tracking customer experience KPIs helps you stay in tune with customer needs and pain points. For example, if you see a dip in customer satisfaction scores, it's a clear sign that something — whether it's your core offerings or customer service — needs attention. By intervening early, you can turn these momentary setbacks into opportunities to boost customer satisfaction and avoid bigger issues down the road.
Fuels data-driven decision-making
Metrics like customer effort score (CES) or churn rate are fantastic at highlighting product flaws, system gaps or process inefficiencies. By asking your customers the right questions through surveys, you'll uncover insights your R&D or product team might have missed. These insights lead to smarter, data-backed decisions and product improvements that truly resonate with your customers.
Boosts customer retention
According to CX statistics, customers with exceptional experiences are likely to spend 140% more than those with less favorable ones. Tracking customer experience KPIs helps you understand why customers stay — or leave. Knowing these reasons allows you to craft targeted strategies to improve customer engagement, satisfaction and retention. The result? Happier, loyal customers who keep coming back.
Lends a competitive edge
MarTech Alliance reports that nearly 48% of businesses admit their customer experience doesn't meet expectations. The ability to adapt to changing customer needs and consistently meet or exceed those expectations only happens when tracking customer experience KPIs becomes second nature. Over time, this practice will become your strongest competitive advantage, keeping you ahead of the pack.
Drives revenue growth
When you track customer experience KPIs closely, you can pinpoint and fix bottlenecks in the customer journey, leading to shorter sales cycles and faster conversions. Continuously refining the customer experience doesn't just create happy customers — it increases customer lifetime value, generates positive word-of-mouth, and ultimately boosts revenue.
9 customer experiences (CX) KPIs to consider
Once you understand the importance of customer experience KPIs, the next step is to identify the ones you need to focus on. Here are the nine most crucial ones.
1. Net promoter score (NPS)
Net promoter score (NPS) is one of the most popular and important customer experience KPIs for measuring customer loyalty and satisfaction. It’s based on a simple question: “On a scale of 0-10, how likely are you to recommend our product/service to a friend or colleague?” Responses are grouped into 3 categories:
😊 Promoters (9-10)
😐 Passives (7-8)
😞 Detractors (0-6)
The NPS is calculated by subtracting the percentage of Detractors from the percentage of Promoters:
Imagine sending an NPS survey for your product to 1000 users and receiving the following ratings:
Ratings (on a scale of 0-10) | Number of customers |
0-6 (Detractors) | 100 |
7 or 8 (Passives) | 200 |
9 or 10 (Promoters) | 700 |
In this case, your NPS is:
70% (Promoters) − 20% (Detractors) = 50
This NPS indicates that you have more satisfied customers than unhappy ones, suggesting high customer satisfaction.
📌 Learn More: How to Improve the Net Promoter Score of Your Brand
2. Customer satisfaction score (CSAT)
The customer satisfaction score measures customers' satisfaction with a specific interaction, product or service. Generally, customers are asked to rate their satisfaction on a scale (e.g., 1-5 or 1-10) and the CSAT is calculated as the percentage of positive responses.
Here's how you can calculate CSAT using the formula below:
Consider this scenario: you conclude 200 customer interactions with a survey asking them to rate their satisfaction on a scale of 1 to 5. Out of these, 150 customers rate the experience as 5.
So, your CSAT score is (150/200) x 100 = 75%.
A 75% CSAT score shows that most customers were satisfied with their experience, but there’s still room for improvement. CSAT is an excellent tool for pinpointing areas that need immediate attention, enabling businesses to address pain points and boost satisfaction swiftly. It’s also helpful for comparing satisfaction levels across different customer segments or periods, providing actionable insights.
💡Do you know
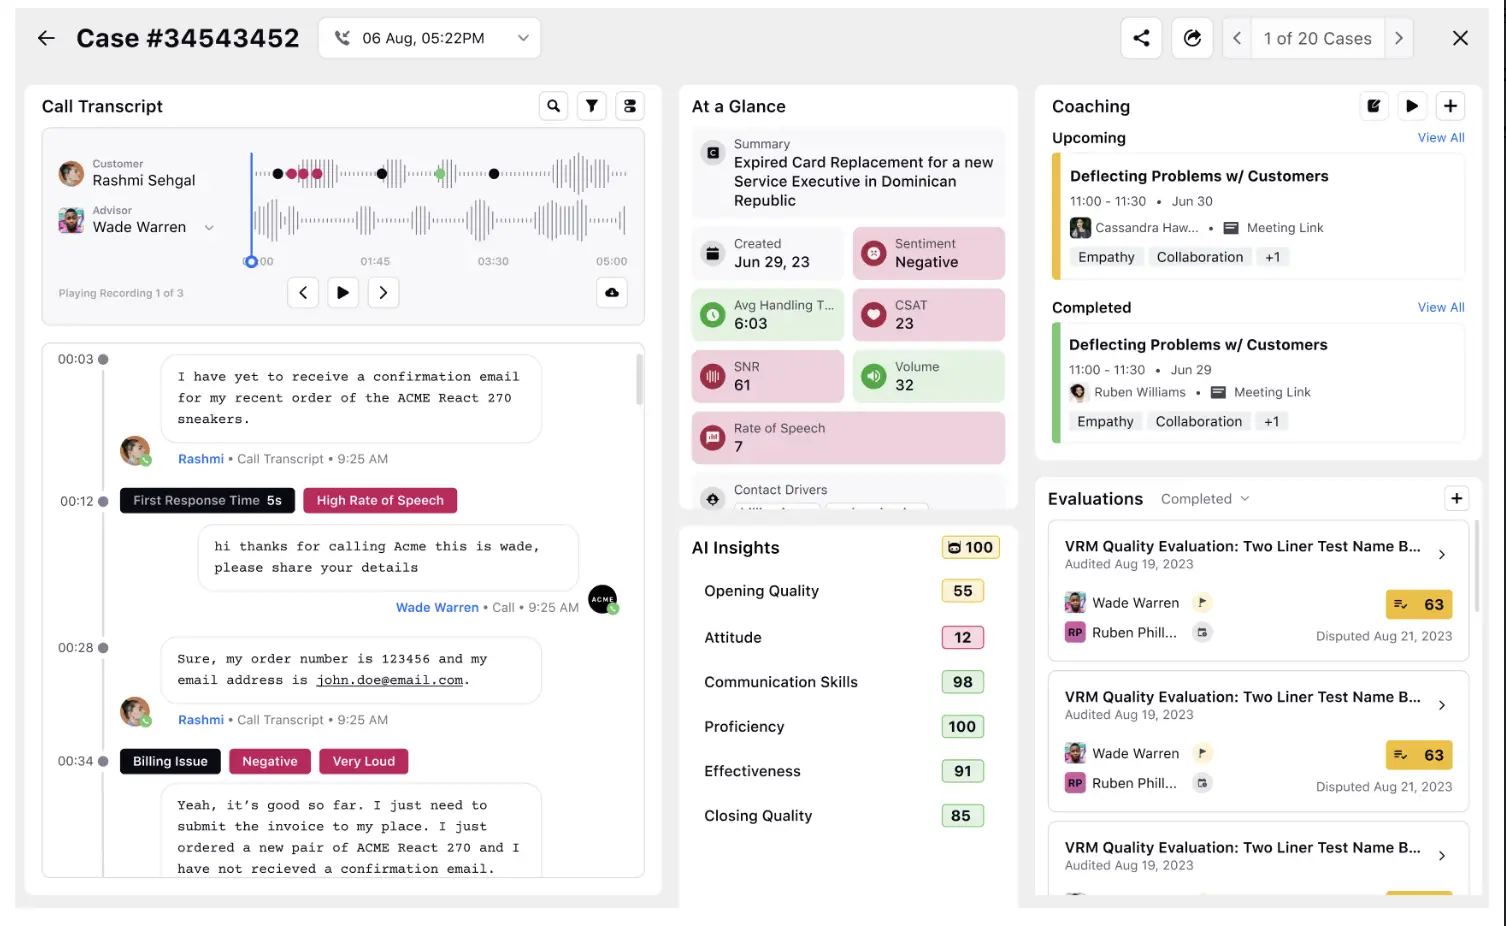
Modern conversational analytics software can take your CSAT tracking to the next level. They let you predict CSAT scores during live conversations and analyze real-time fluctuations as interactions unfold.
You can identify specific messages from the customer or the agent that trigger positive or negative shifts in CSAT, giving you precise insights into what drives customer satisfaction. Using these tools lets you catch issues early and course-correct in real time, ensuring every interaction adds value to the customer experience.

3. Customer churn rate
Customer churn rate (CCR) is the percentage of customers who stop using your product or service over a specific period. Keeping an eye on churn rate (also known as attrition rate) gives you vital insights into why customers are leaving and enables you to take proactive steps to reduce churn.
Here’s how you can calculate it:
For instance, if you lose 100 customers out of 1,000 over a year, your churn rate is (100/1000) x 100 = 10%.
The churn rate has a direct impact on both revenue and growth. A high churn rate signals that something isn’t clicking, whether it’s dissatisfaction with the product, service quality, or a more appealing offer from competitors. The lower your churn rate, the better your customer retention management — and ultimately, your bottom line.
🎯 Action Plan: 22 Customer Retention Strategies for 2025
APV - Average Purchase Value
If a customer typically spends $500 a year with your company and stays with you for five years, their CLV is 500 x 5 = $2500.
Focusing on high-CLV customer segments allows you to allocate resources more effectively, ensuring efforts are directed where they matter most. It guides marketing by determining the budget for acquiring new customers. Additionally, you can boost revenue and profitability by identifying and retaining high-value customers.
5. Average resolution time (ART)
It tracks the average time it takes to fully resolve a customer’s issue from the moment they first contact your support team. Shorter resolution times generally lead to higher customer satisfaction.
Here’s how you can calculate ART:
For instance, if your company took 1000 hours to handle 500 tickets, your ART is 1000/500 = 2 hours.
Average resolution time measures the efficiency of your company’s customer support team in resolving issues. Plus, it enables you to set and track service level agreements (SLAs) for resolution times.
😊 Good to know
As customer issues grow more complex, average resolution times often increase, leading to longer hold times for customers still waiting in the queue. The key to resolving this challenge lies in empowering your agents to resolve issues quickly and efficiently, enabling them to assist the next customer without unnecessary delays.
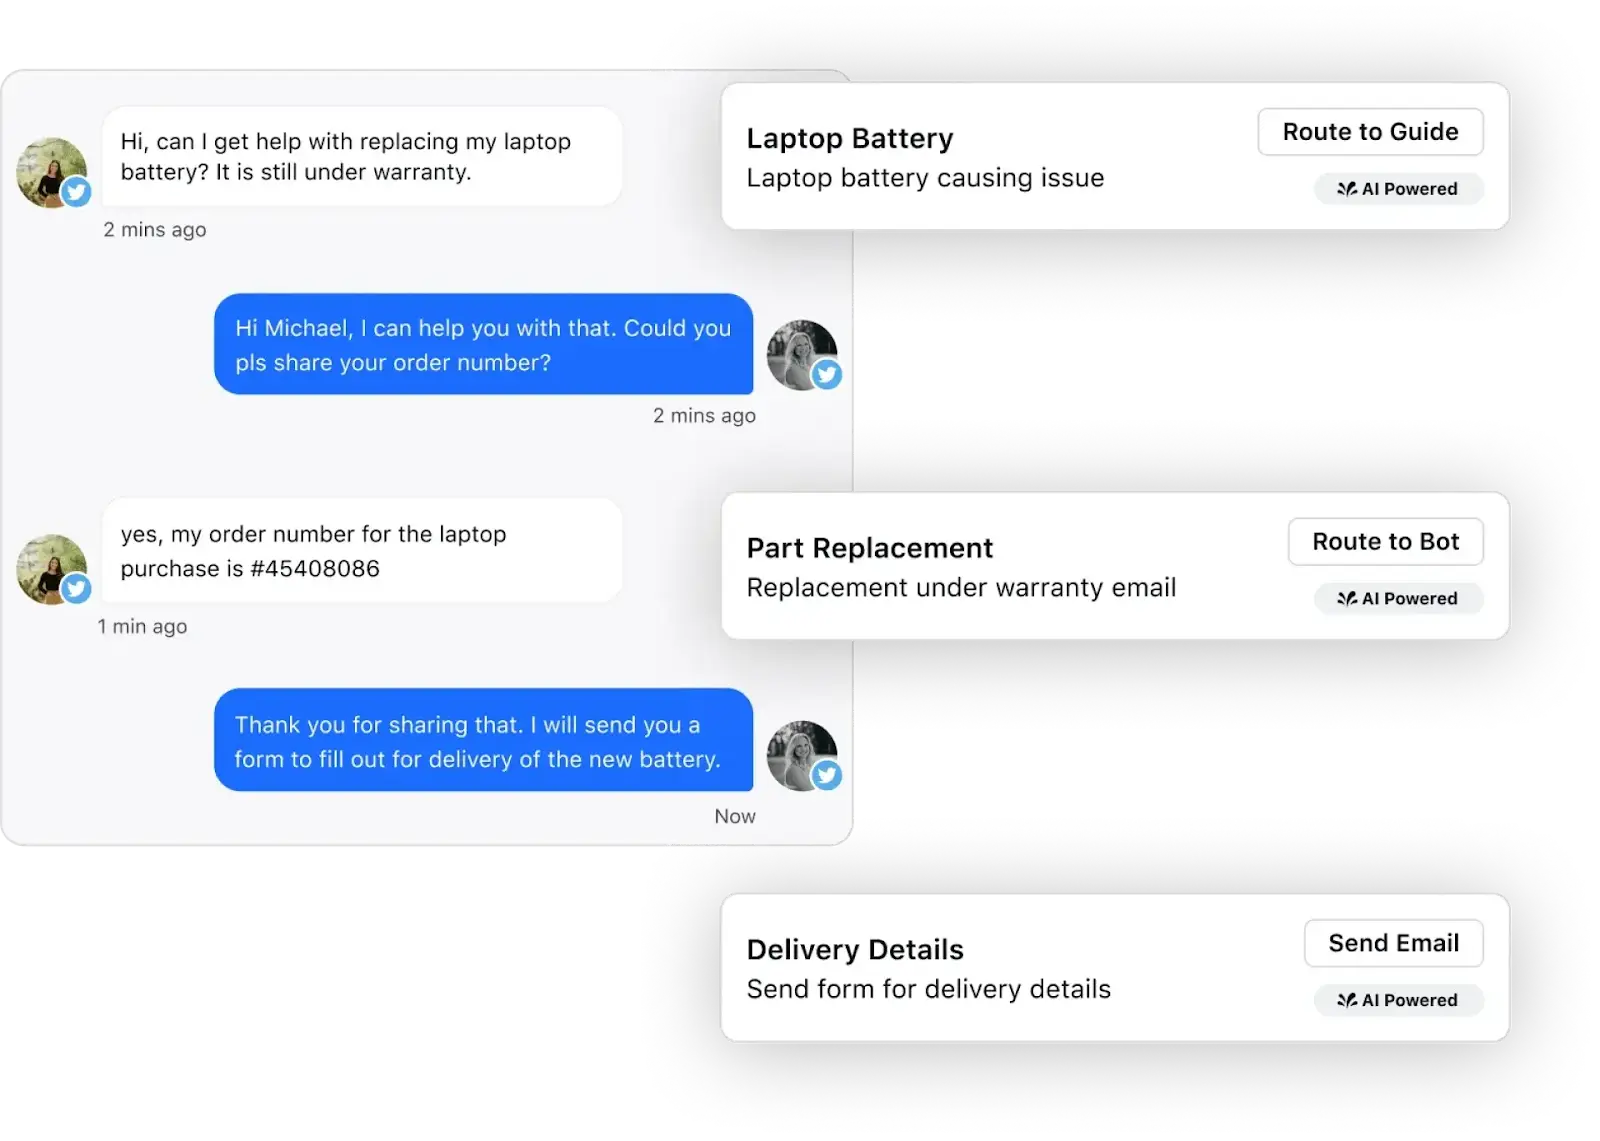
Sprinklr’s AI-powered agent assist software does precisely that. By offering real-time suggestions, pre-filled responses and access to a unified knowledge base during customer interactions, the tool enables agents to resolve cases faster.
The agent assist also helps agents pinpoint the fastest path to resolution, while predictive analytics anticipate customer needs before they’re even voiced. This speeds up resolutions and creates smoother, more satisfying customer experiences.
6. Customer effort score (CES)
Customer effort score (CES) measures how easy it is for customers to interact with your business. Whether they're resolving an issue, making a purchase or returning a product, CES gauges the ease of these interactions. A CES survey is typically prompted at key customer touchpoints, such as after billing or support ticket resolution, asking customers: "How easy was it to resolve your issue today?" Customers rate their experience from "Very Easy" to "Very Difficult."
You can customize the survey using a 1-10 scale, an emoji rating system or whatever suits your brand's style. This allows customers to rate their interaction based on how smooth or complex the process felt.
Tracking CES helps you pinpoint areas of frustration and identify where customers may face friction. It's beneficial for evaluating how well process improvements work.
7. First contact resolution (FCR)
First contact resolution (FCR) measures the percentage of customer inquiries or issues resolved during the first interaction. High FCR rates reflect the efficiency of your customer service, as issues are addressed promptly without needing follow-ups. Since quick issue resolution is a top priority for most customers, tracking your FCR rate is a strong indicator of the quality of your customer experience.
Here’s how to calculate it:
If your support team resolves 80 out of 100 issues on the first contact, your FCR rate is (80/100) x 100 = 80%
This suggests that your team is effective in addressing customer needs promptly. What is a good FCR, you ask? It usually ranges from 70% to 79%, with any rate above 80% considered exceptional.
How Sprinklr AI helps
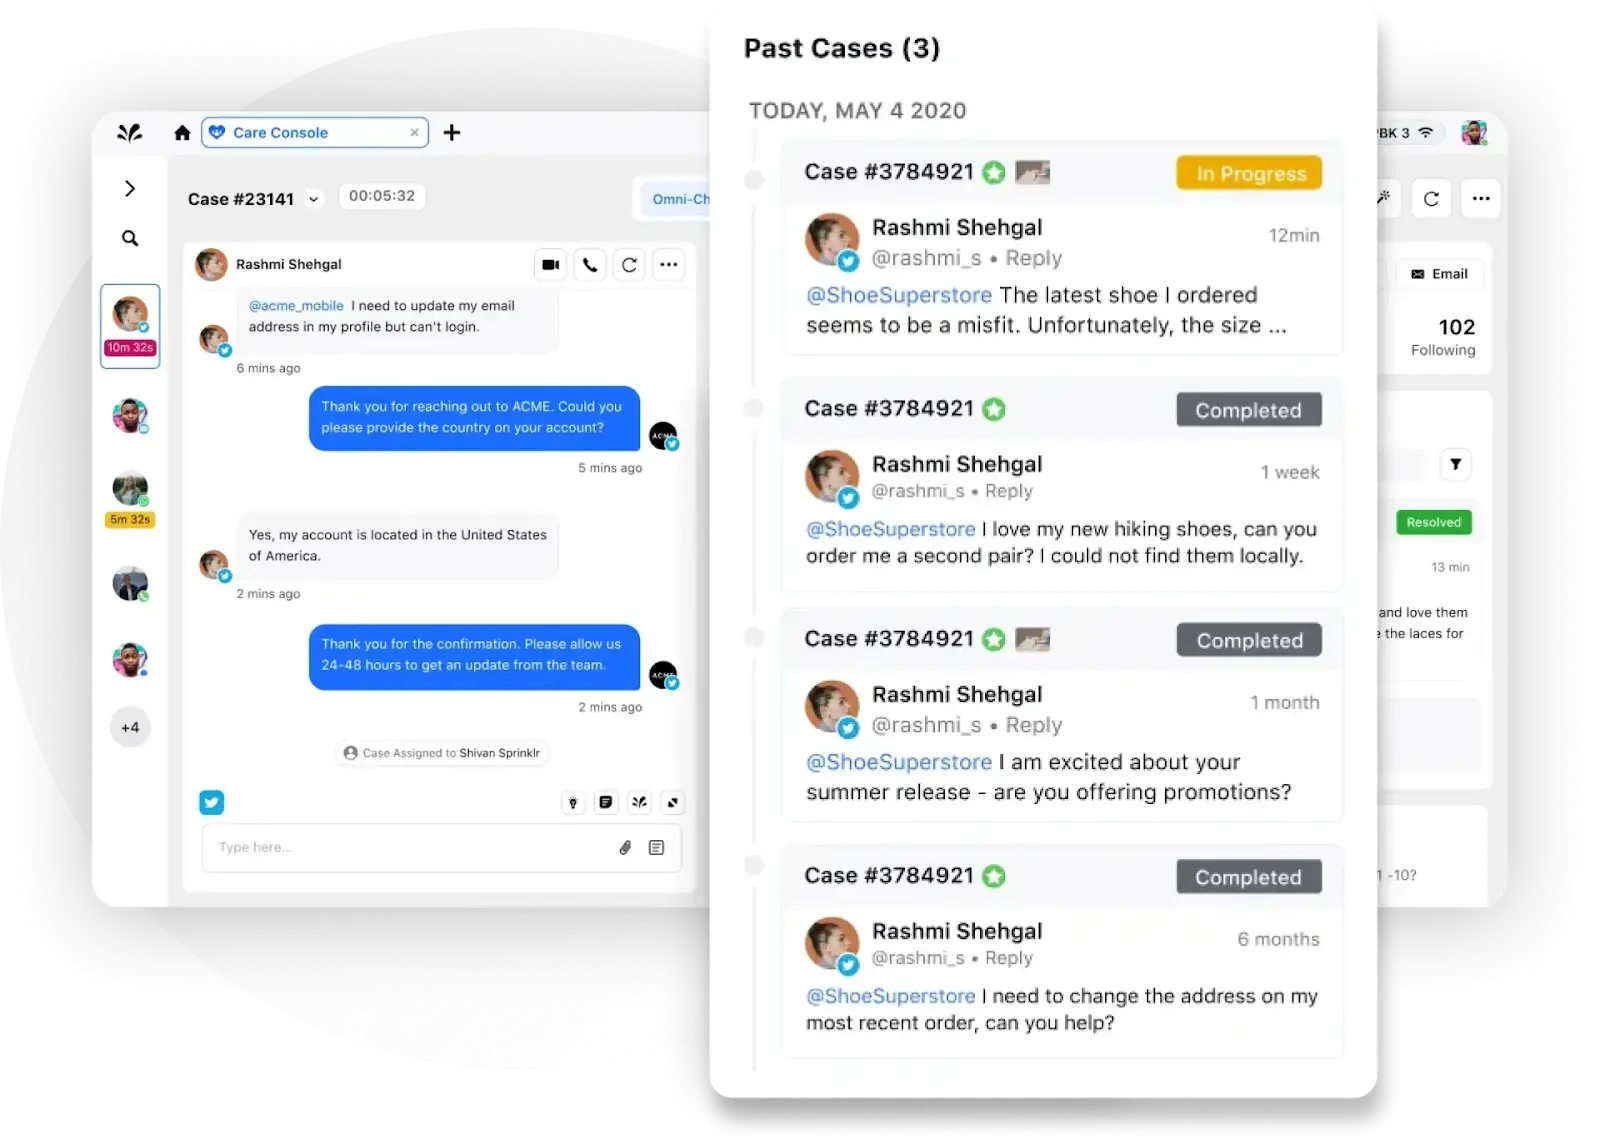
Sprinklr AI enhances FCR by providing agents with real-time support during live calls and chats. Based on the conversation's context, it recommends similar resolved cases, relevant knowledge base articles and guided workflows. This empowers agents to resolve issues faster and more efficiently, often ensuring the issue is handled during the first contact itself.
8. First response time (FRT)
First response time is a crucial customer experience KPI that measures the time it takes from when a customer first reaches out with an issue until they get a response from a support agent.
FRT directly affects how customers feel. People appreciate quick responses to questions or problems; a long wait can lead to frustration. A swift initial response prevents frustration and sets a positive tone for the entire customer service experience.
Here’s how you can calculate it:
If your customer support team resolves 300 inquiries in 1200 minutes, your FRT would be 1200/300 = 4.
In this instance, your support team takes 4 minutes to respond to a customer’s first interaction.
FRT ensures that customer expectations for timely responses are met and allows you to establish and monitor SLAs for response times. By tracking this KPI, you can gauge the support team’s performance and improve their responsiveness to customer needs.
Related Read: 5 ways to improve customer response time with AI
9. Trial-to-paid conversion rate
The trial-to-paid conversion rate tracks the percentage of customers who switch from a free trial or freemium version of your product to a paid subscription or purchase. This KPI gives you insight into how much customers value your offering. Moving from a free trial to a paid version indicates that they like what they’re experiencing.
This metric validates your product. It’s an important number to monitor because it reflects customer satisfaction and potential revenue growth.
Here’s the formula to calculate it:
For instance, if 400 users started a free trial and 80 upgraded to a paid plan, your trial-to-paid conversion rate would be 80/400 = 0.2 or 20%
This KPI offers valuable insights into the effectiveness of your trial offerings and overall product performance. Plus, it provides essential information to guide your marketing management and product strategies, helping you enhance conversion rates and attract more paying customers.
Drill into details and act fast with Sprinklr
Tracking customer experience KPIs is essential for understanding how well your business meets customer expectations. But here's the challenge: Even with the right KPIs, it can be difficult to act quickly on the insights they provide. Your team is likely juggling multiple tools, scattered data and siloed processes, making it harder to respond to customer needs in real-time.
This is where the real opportunity lies — using AI to streamline and unify your customer service operations.
Sprinklr Service, built on the world's only Unified-CXM platform, enables your team to act faster and smarter. By integrating CX insights directly into a unified platform, Sprinklr ensures you impeccably track KPIs like CSAT, NPS, FCR and others discussed above and proactively improve them. With real-time AI suggestions, predictive analytics and a single customer view, your agents can resolve issues efficiently, leading to happier customers.
Try Sprinklr Service and experience the power of AI-driven, seamless customer support today!
Frequently Asked Questions
The most critical KPIs include net promoter score (NPS), customer satisfaction (CSAT), first response time (FRT), customer lifetime value (CLV) and churn rate. These metrics help gauge overall satisfaction, loyalty and the effectiveness of customer support.
KPIs can vary widely. For instance, e-commerce may focus more on KPIs like customer effort score, while service industries prioritize first response time and customer satisfaction. The choice of KPIs depends on what is most relevant to the customer experience in each sector or model.
Businesses can align KPIs with objectives by selecting metrics that directly reflect their strategic goals, such as improving customer retention or increasing sales. Regularly reviewing and adjusting KPIs ensures they remain relevant in an evolving business landscape.
Various tools and platforms comprehensively track and analyze different customer experience KPIs. Sprinklr’s unified CXM platform is trusted by the world’s biggest brands, such as Microsoft, MOEN, Shell, etc.
